What are Self-Funded Health Plans?
Self-funded (or self-insured) health plans are employer-sponsored plans where the organization assumes financial responsibility for providing healthcare benefits to employees. Instead of paying fixed premiums to an insurance company, employers pay for actual medical claims as they occur, plus administrative costs.
Key Benefits
- Potential cost savings of 10-25%
- Greater plan design flexibility
- Access to detailed claims data
- No state insurance premium taxes
- Cash flow advantages
Key Considerations
- Financial risk exposure
- Administrative complexity
- ERISA/CAA fiduciary responsibilities
- Need for stop-loss insurance
- Claims volatility management
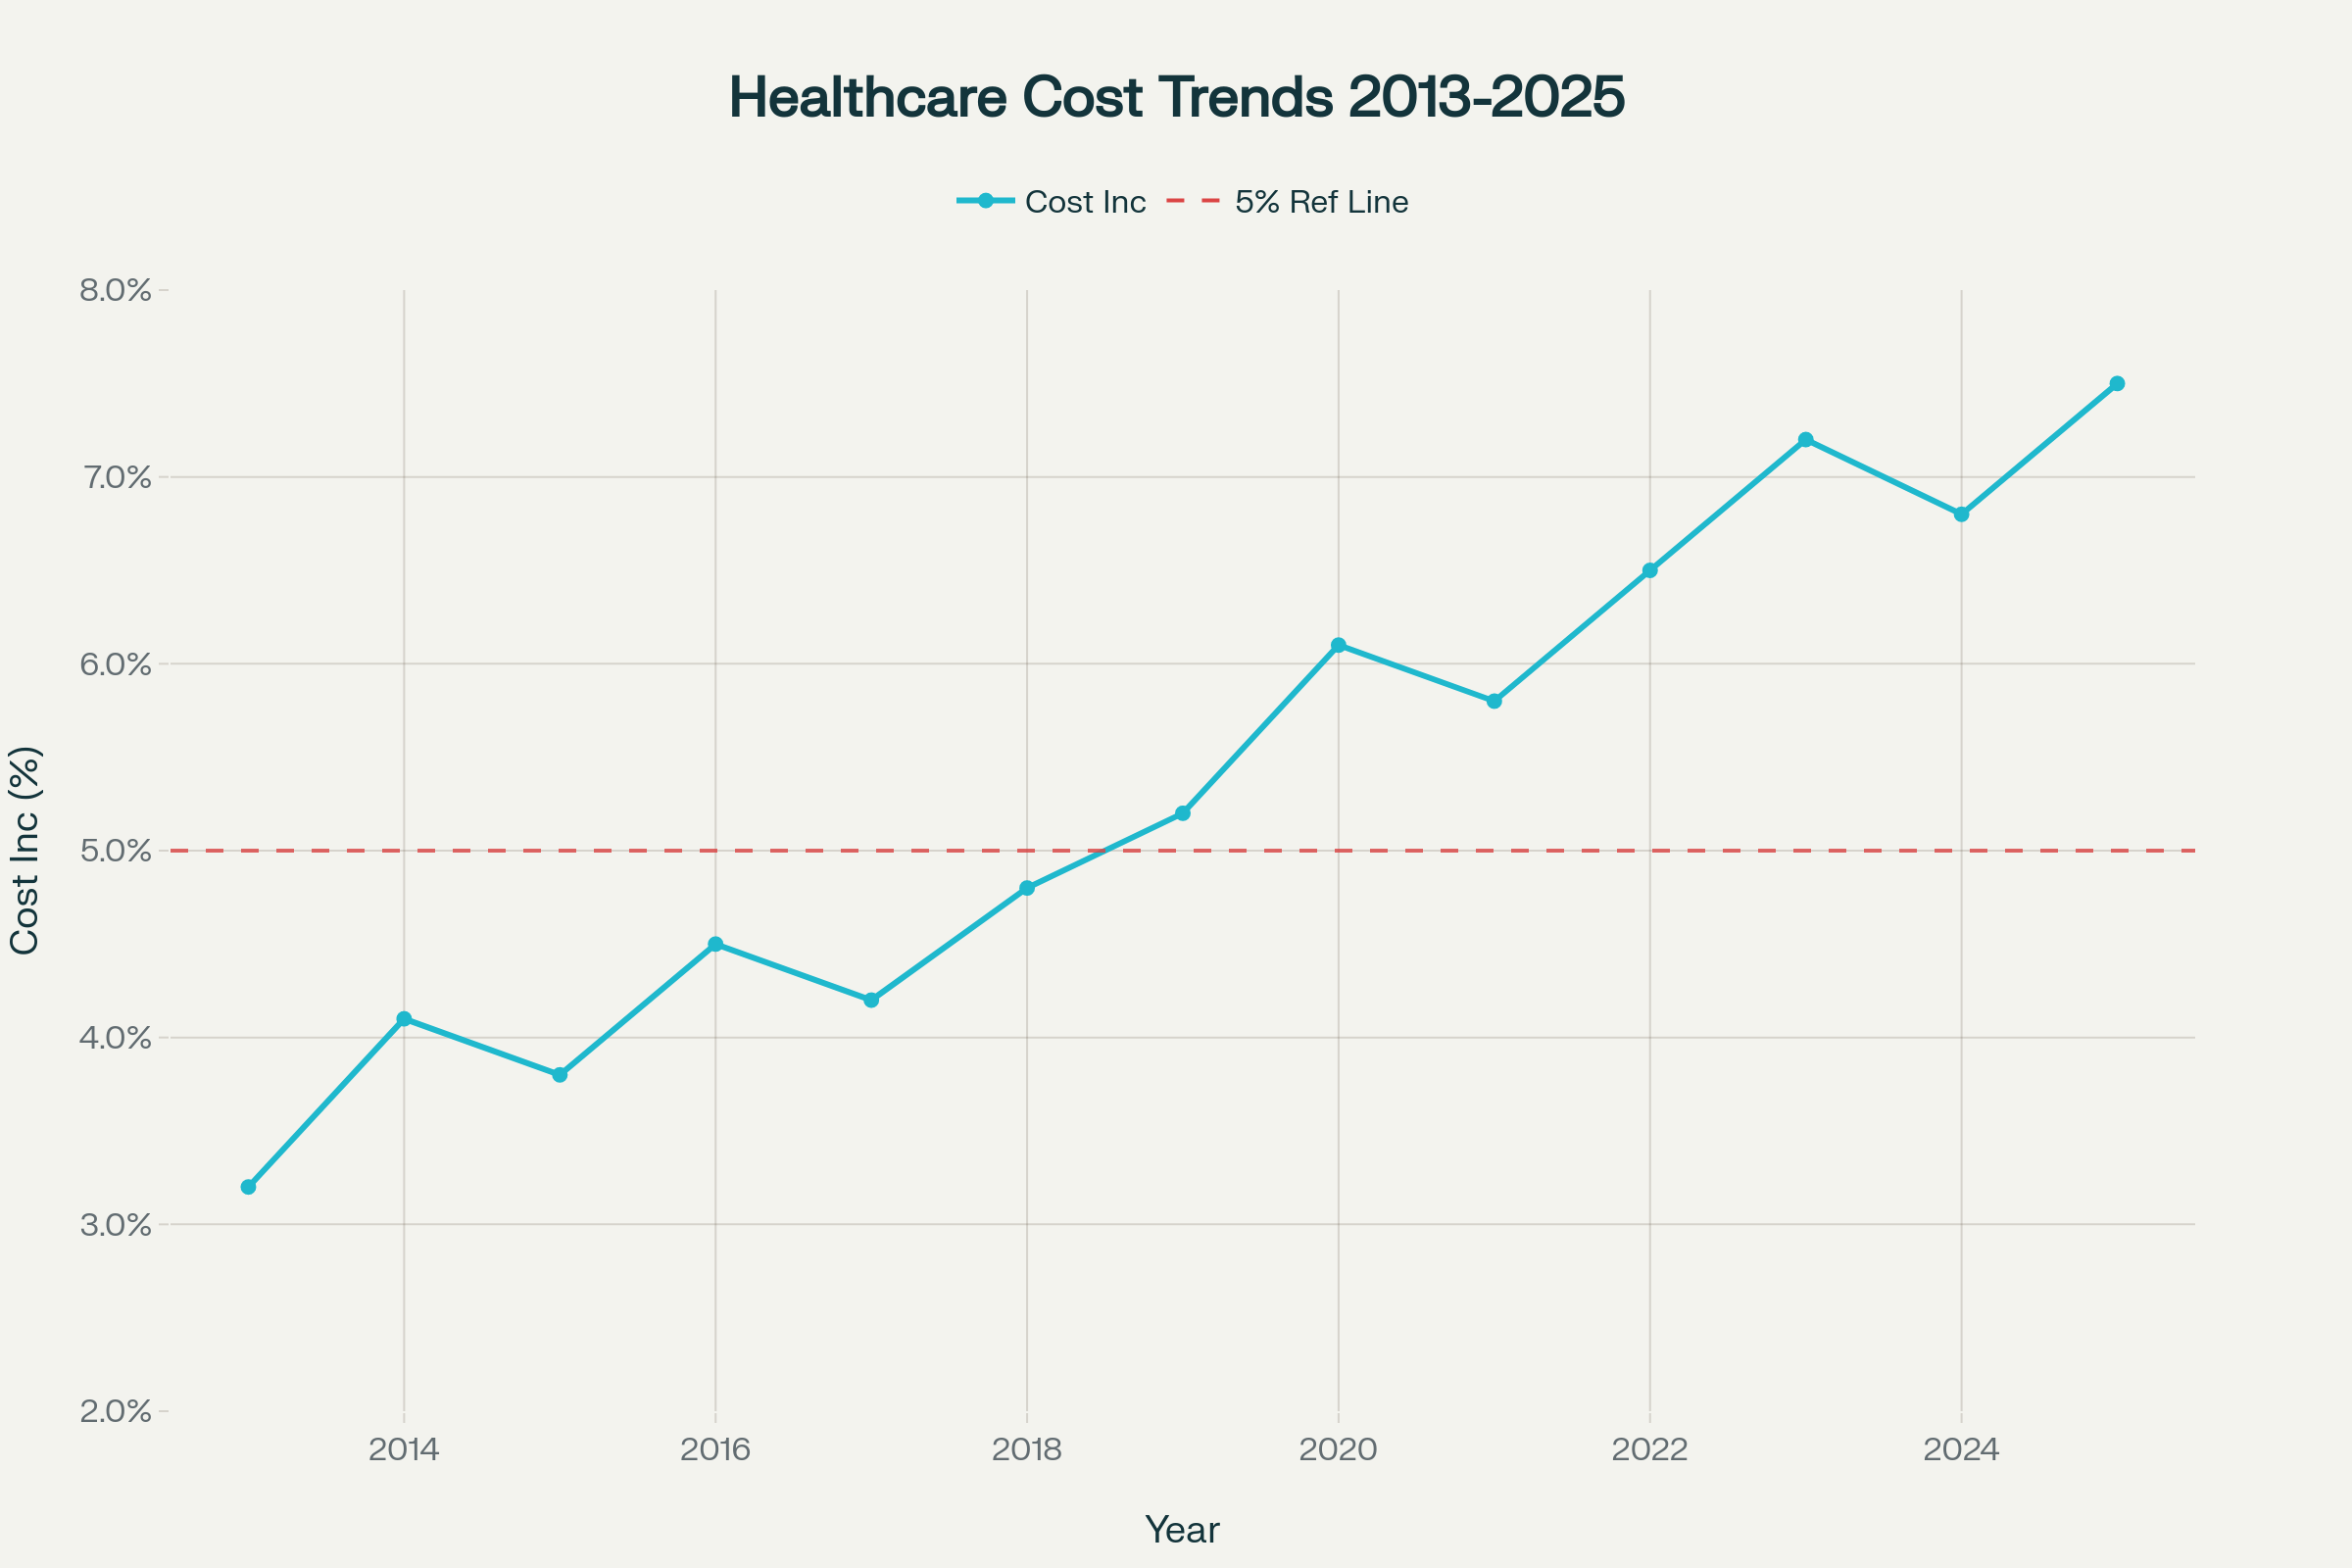
Healthcare Cost Trends Analysis
Healthcare costs have been accelerating, with three consecutive years above 5% increases
Primary Cost Drivers
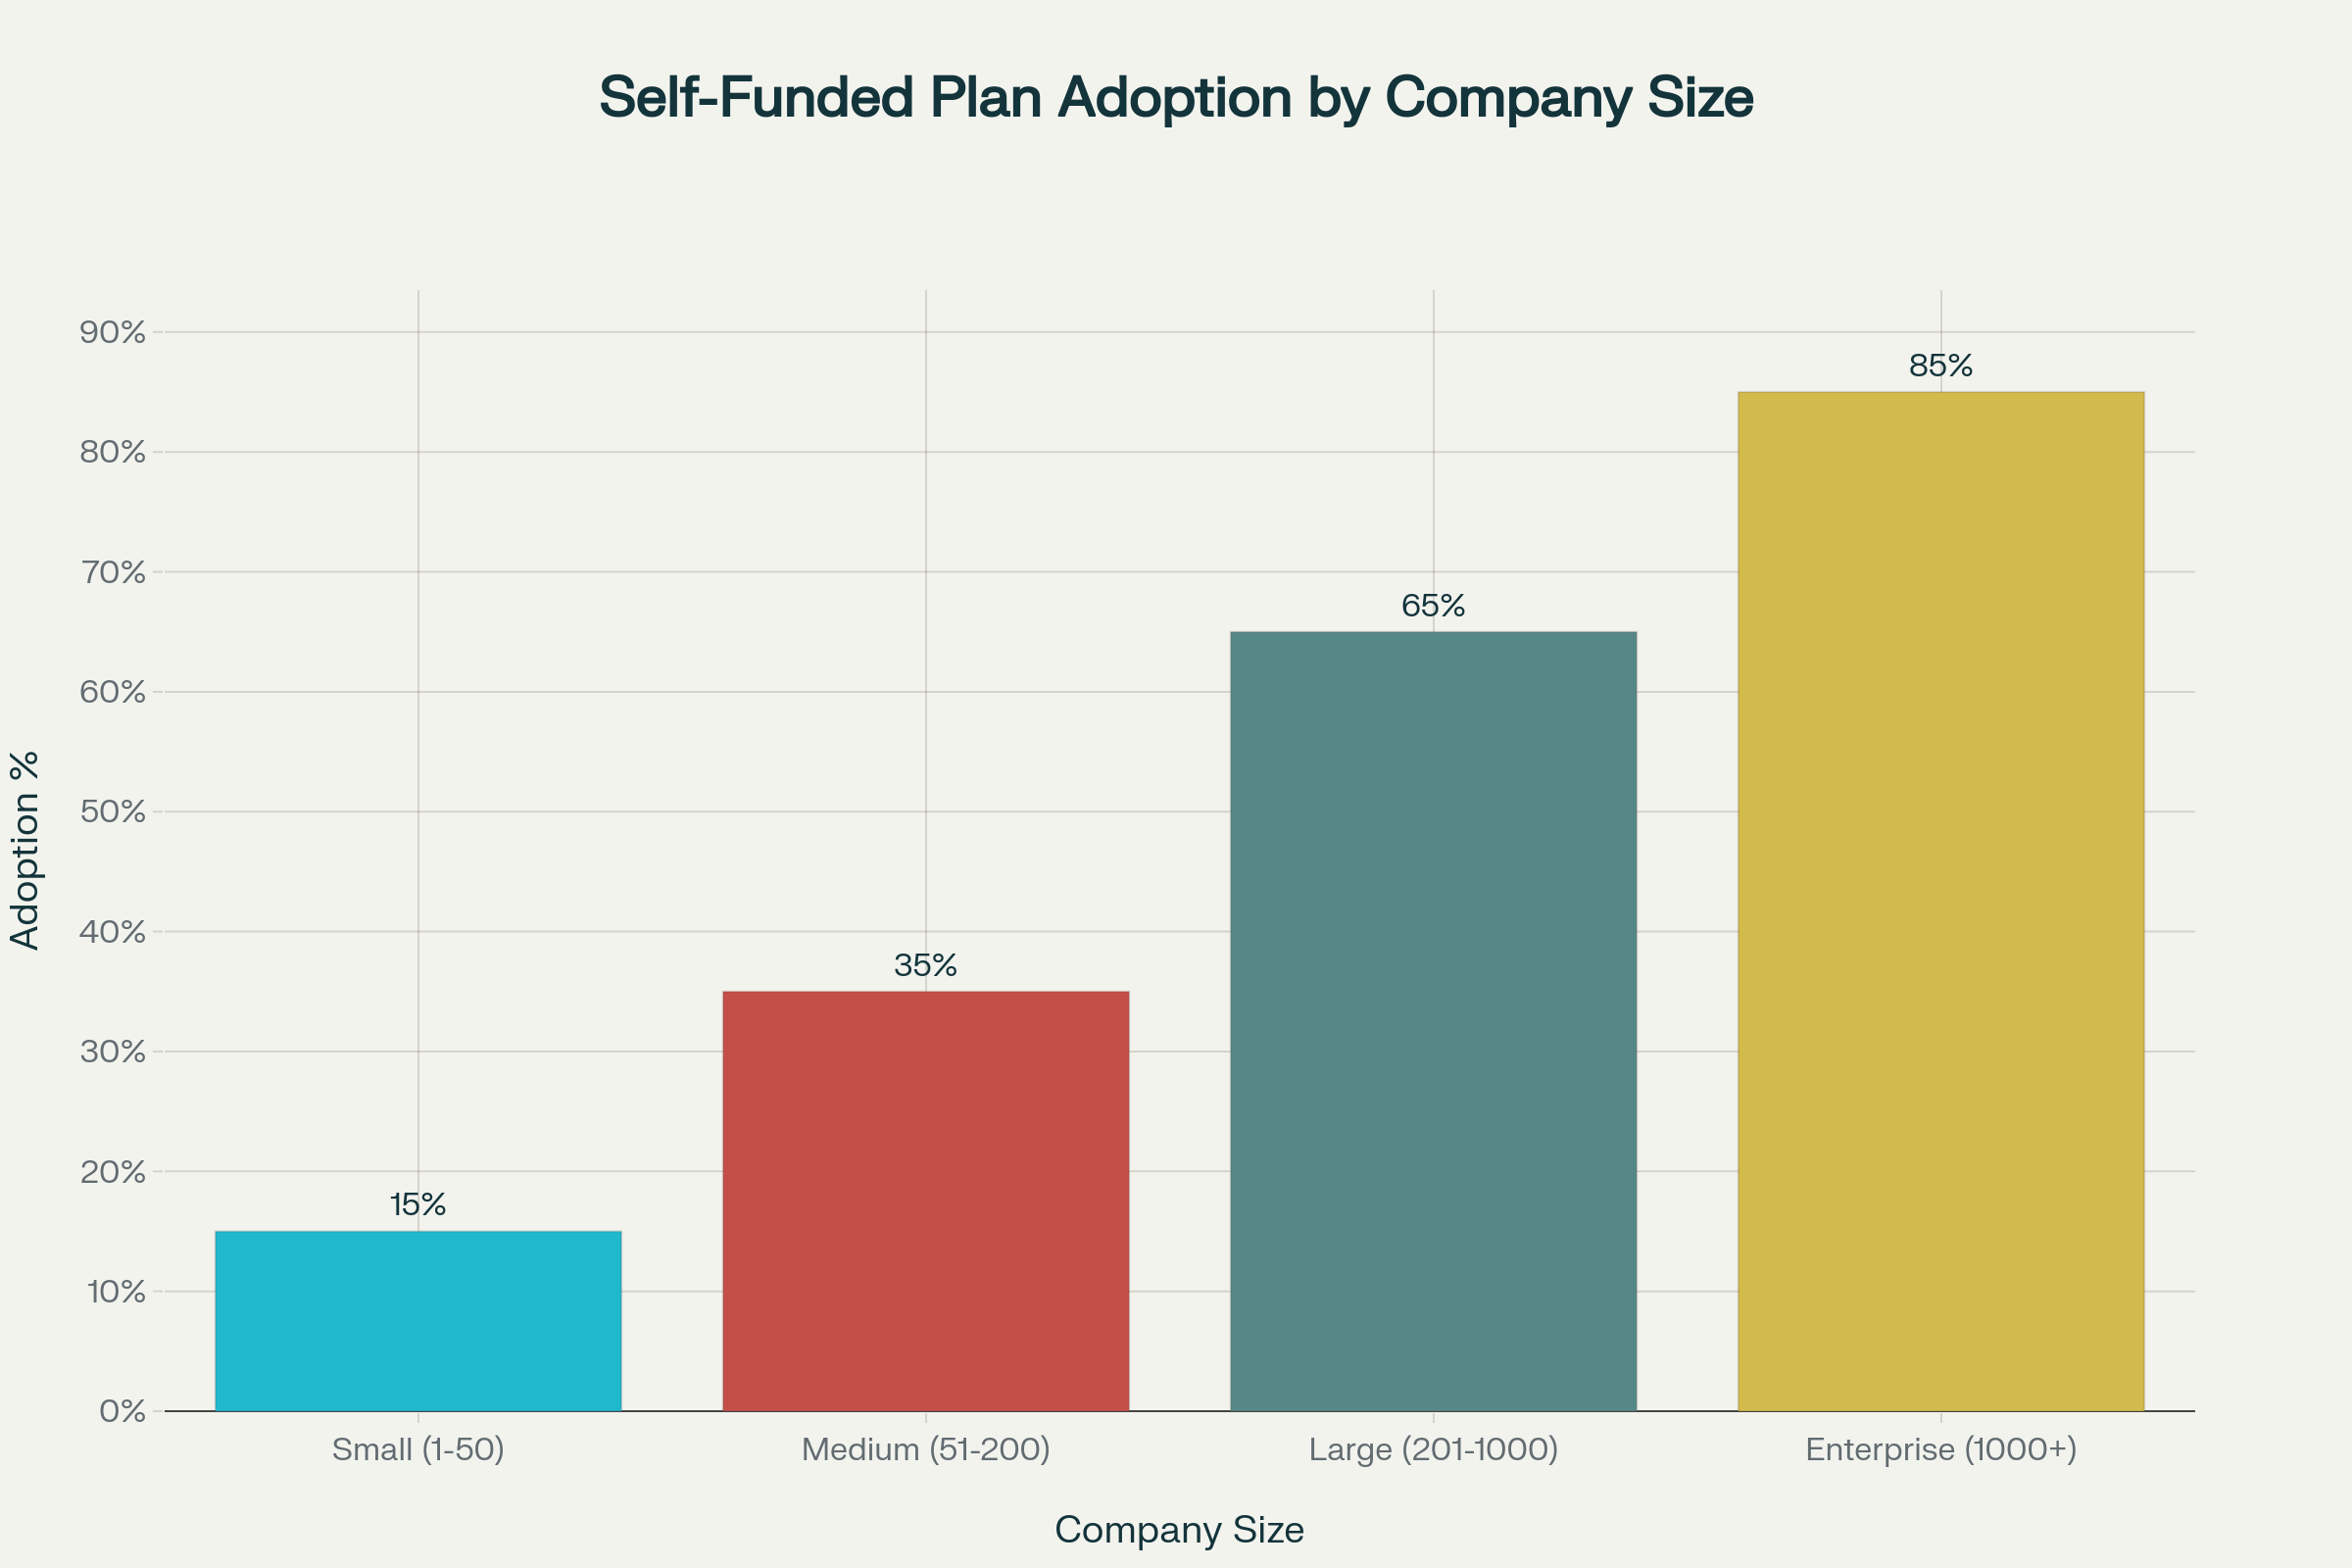
Self-Funded Plan Adoption Analysis
Adoption rates vary significantly by company size and industry
Industry Performance Comparison
| Industry | Success Rate | Avg Savings | Employee Satisfaction |
|---|
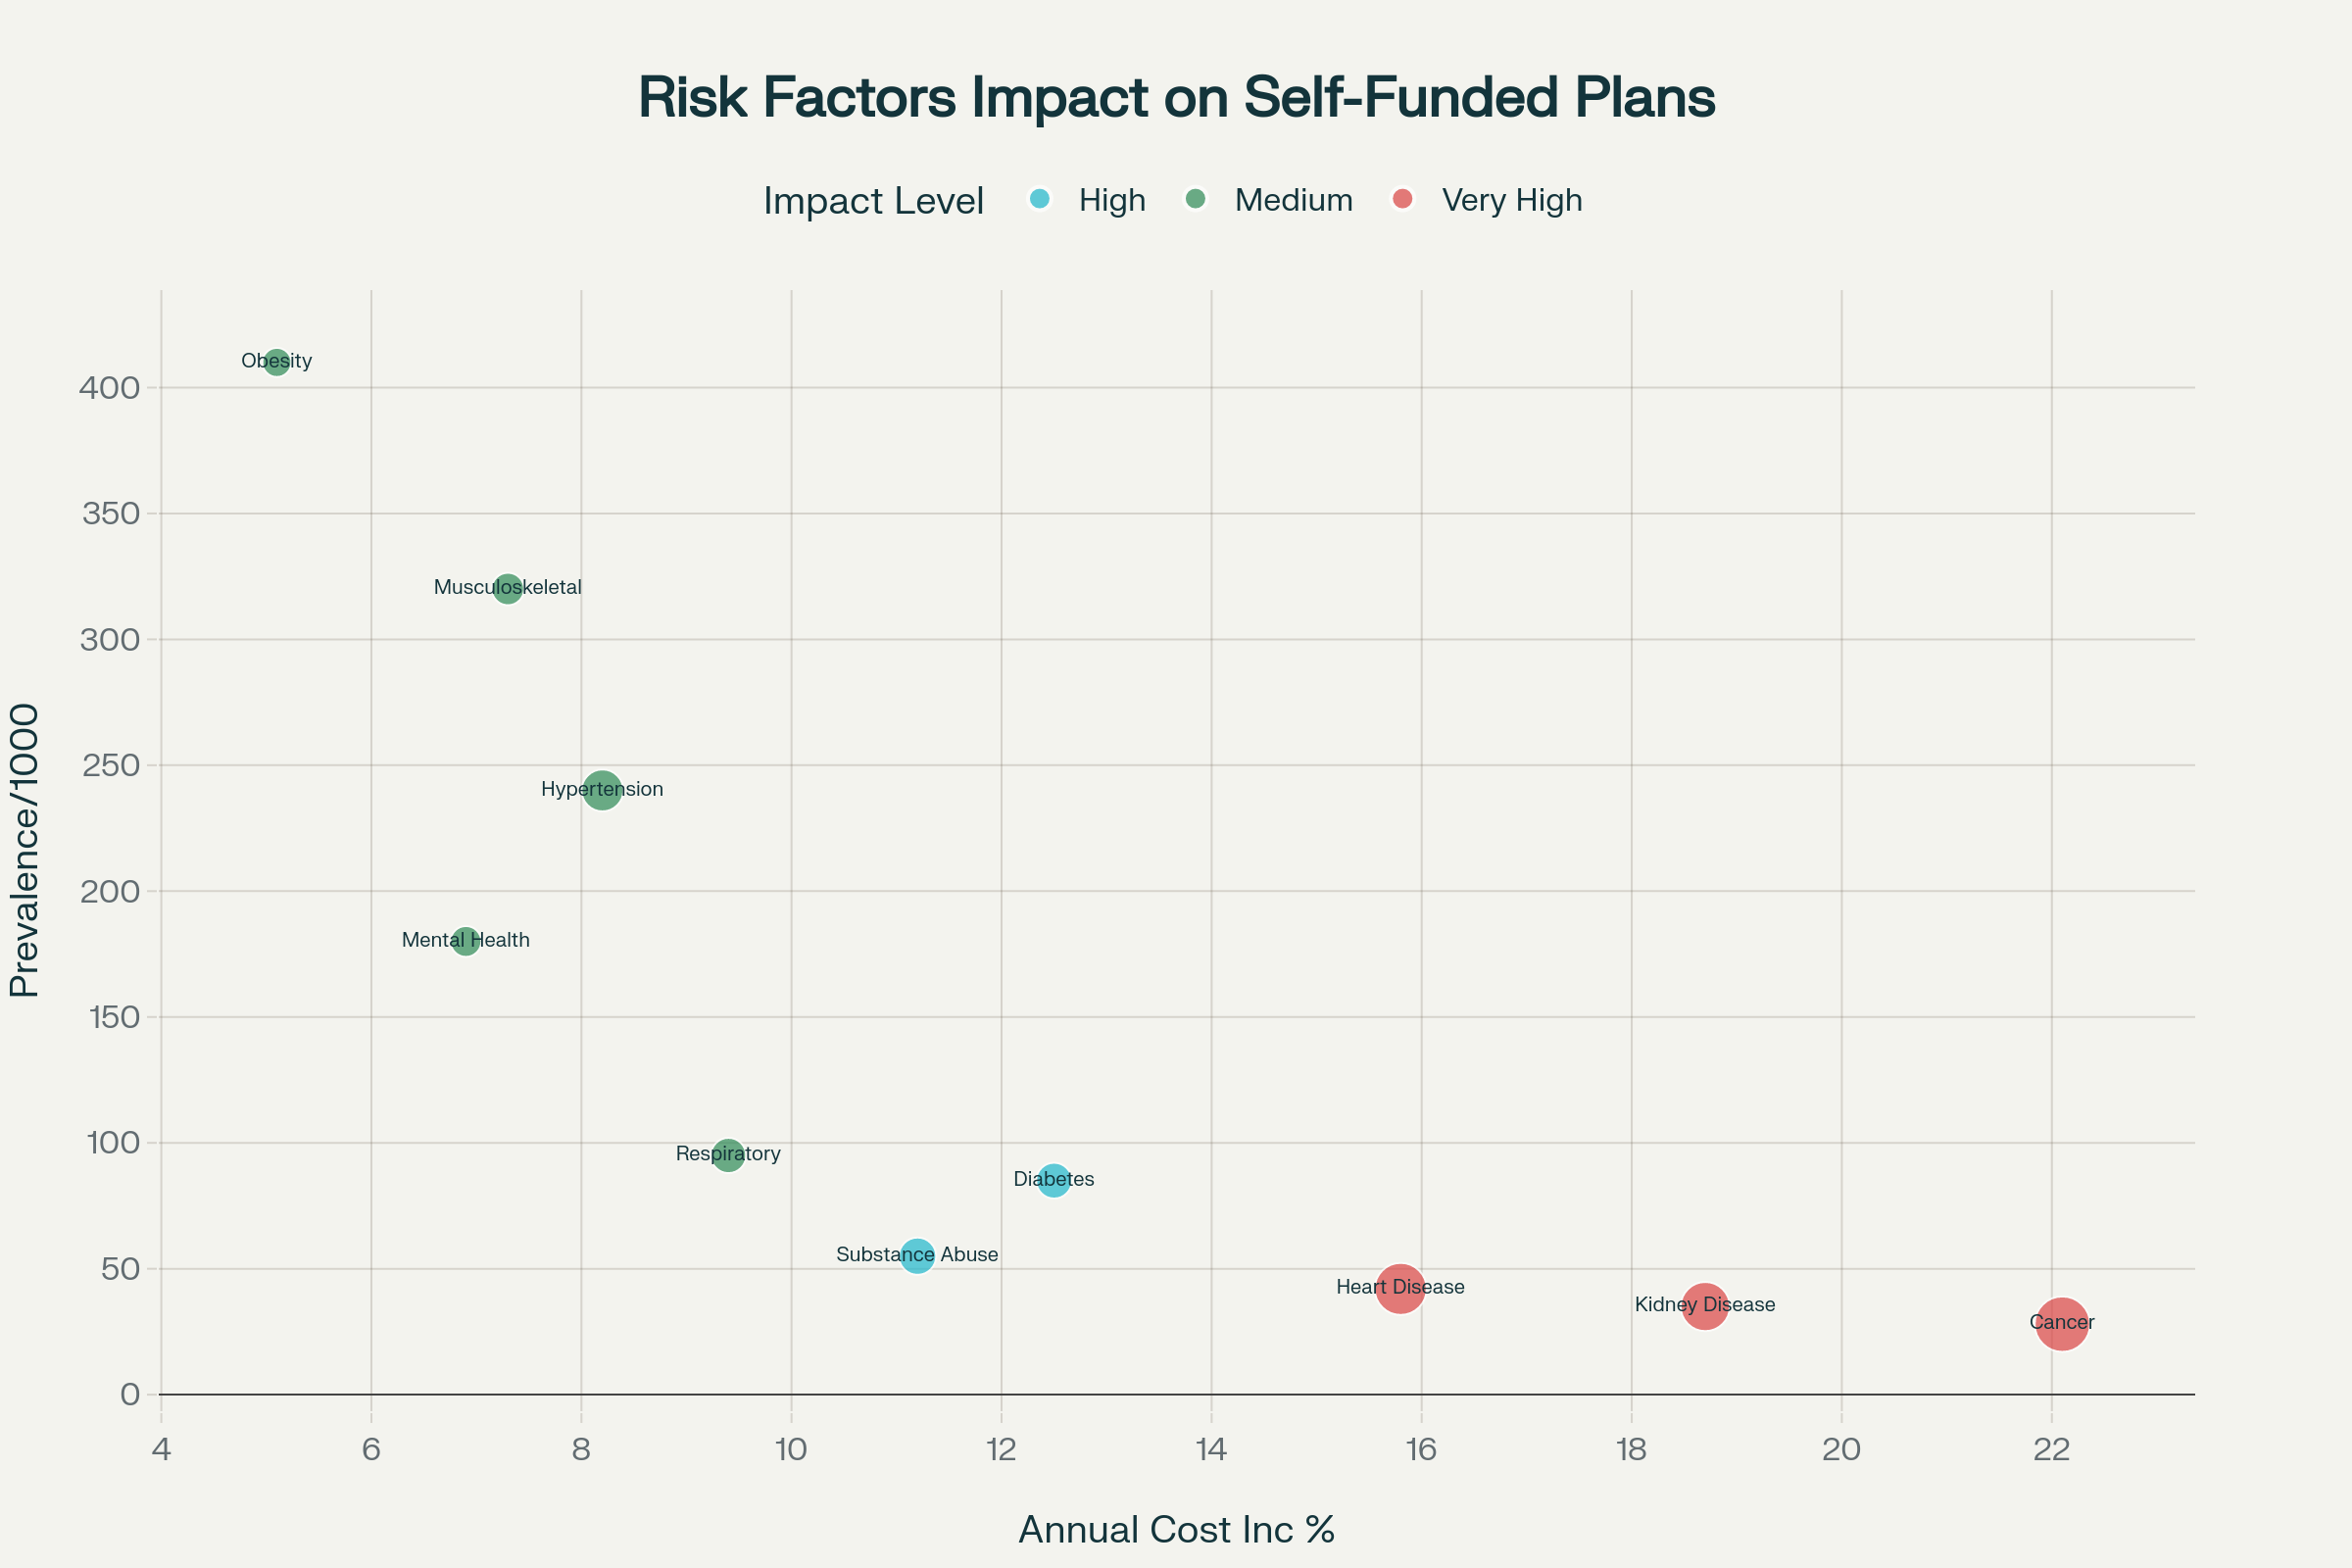
Risk Assessment & Management
Understanding and mitigating financial risks in self-funded plans
Stop-Loss Insurance Thresholds
| Company Size | Specific Stop-Loss | Aggregate Attachment |
|---|
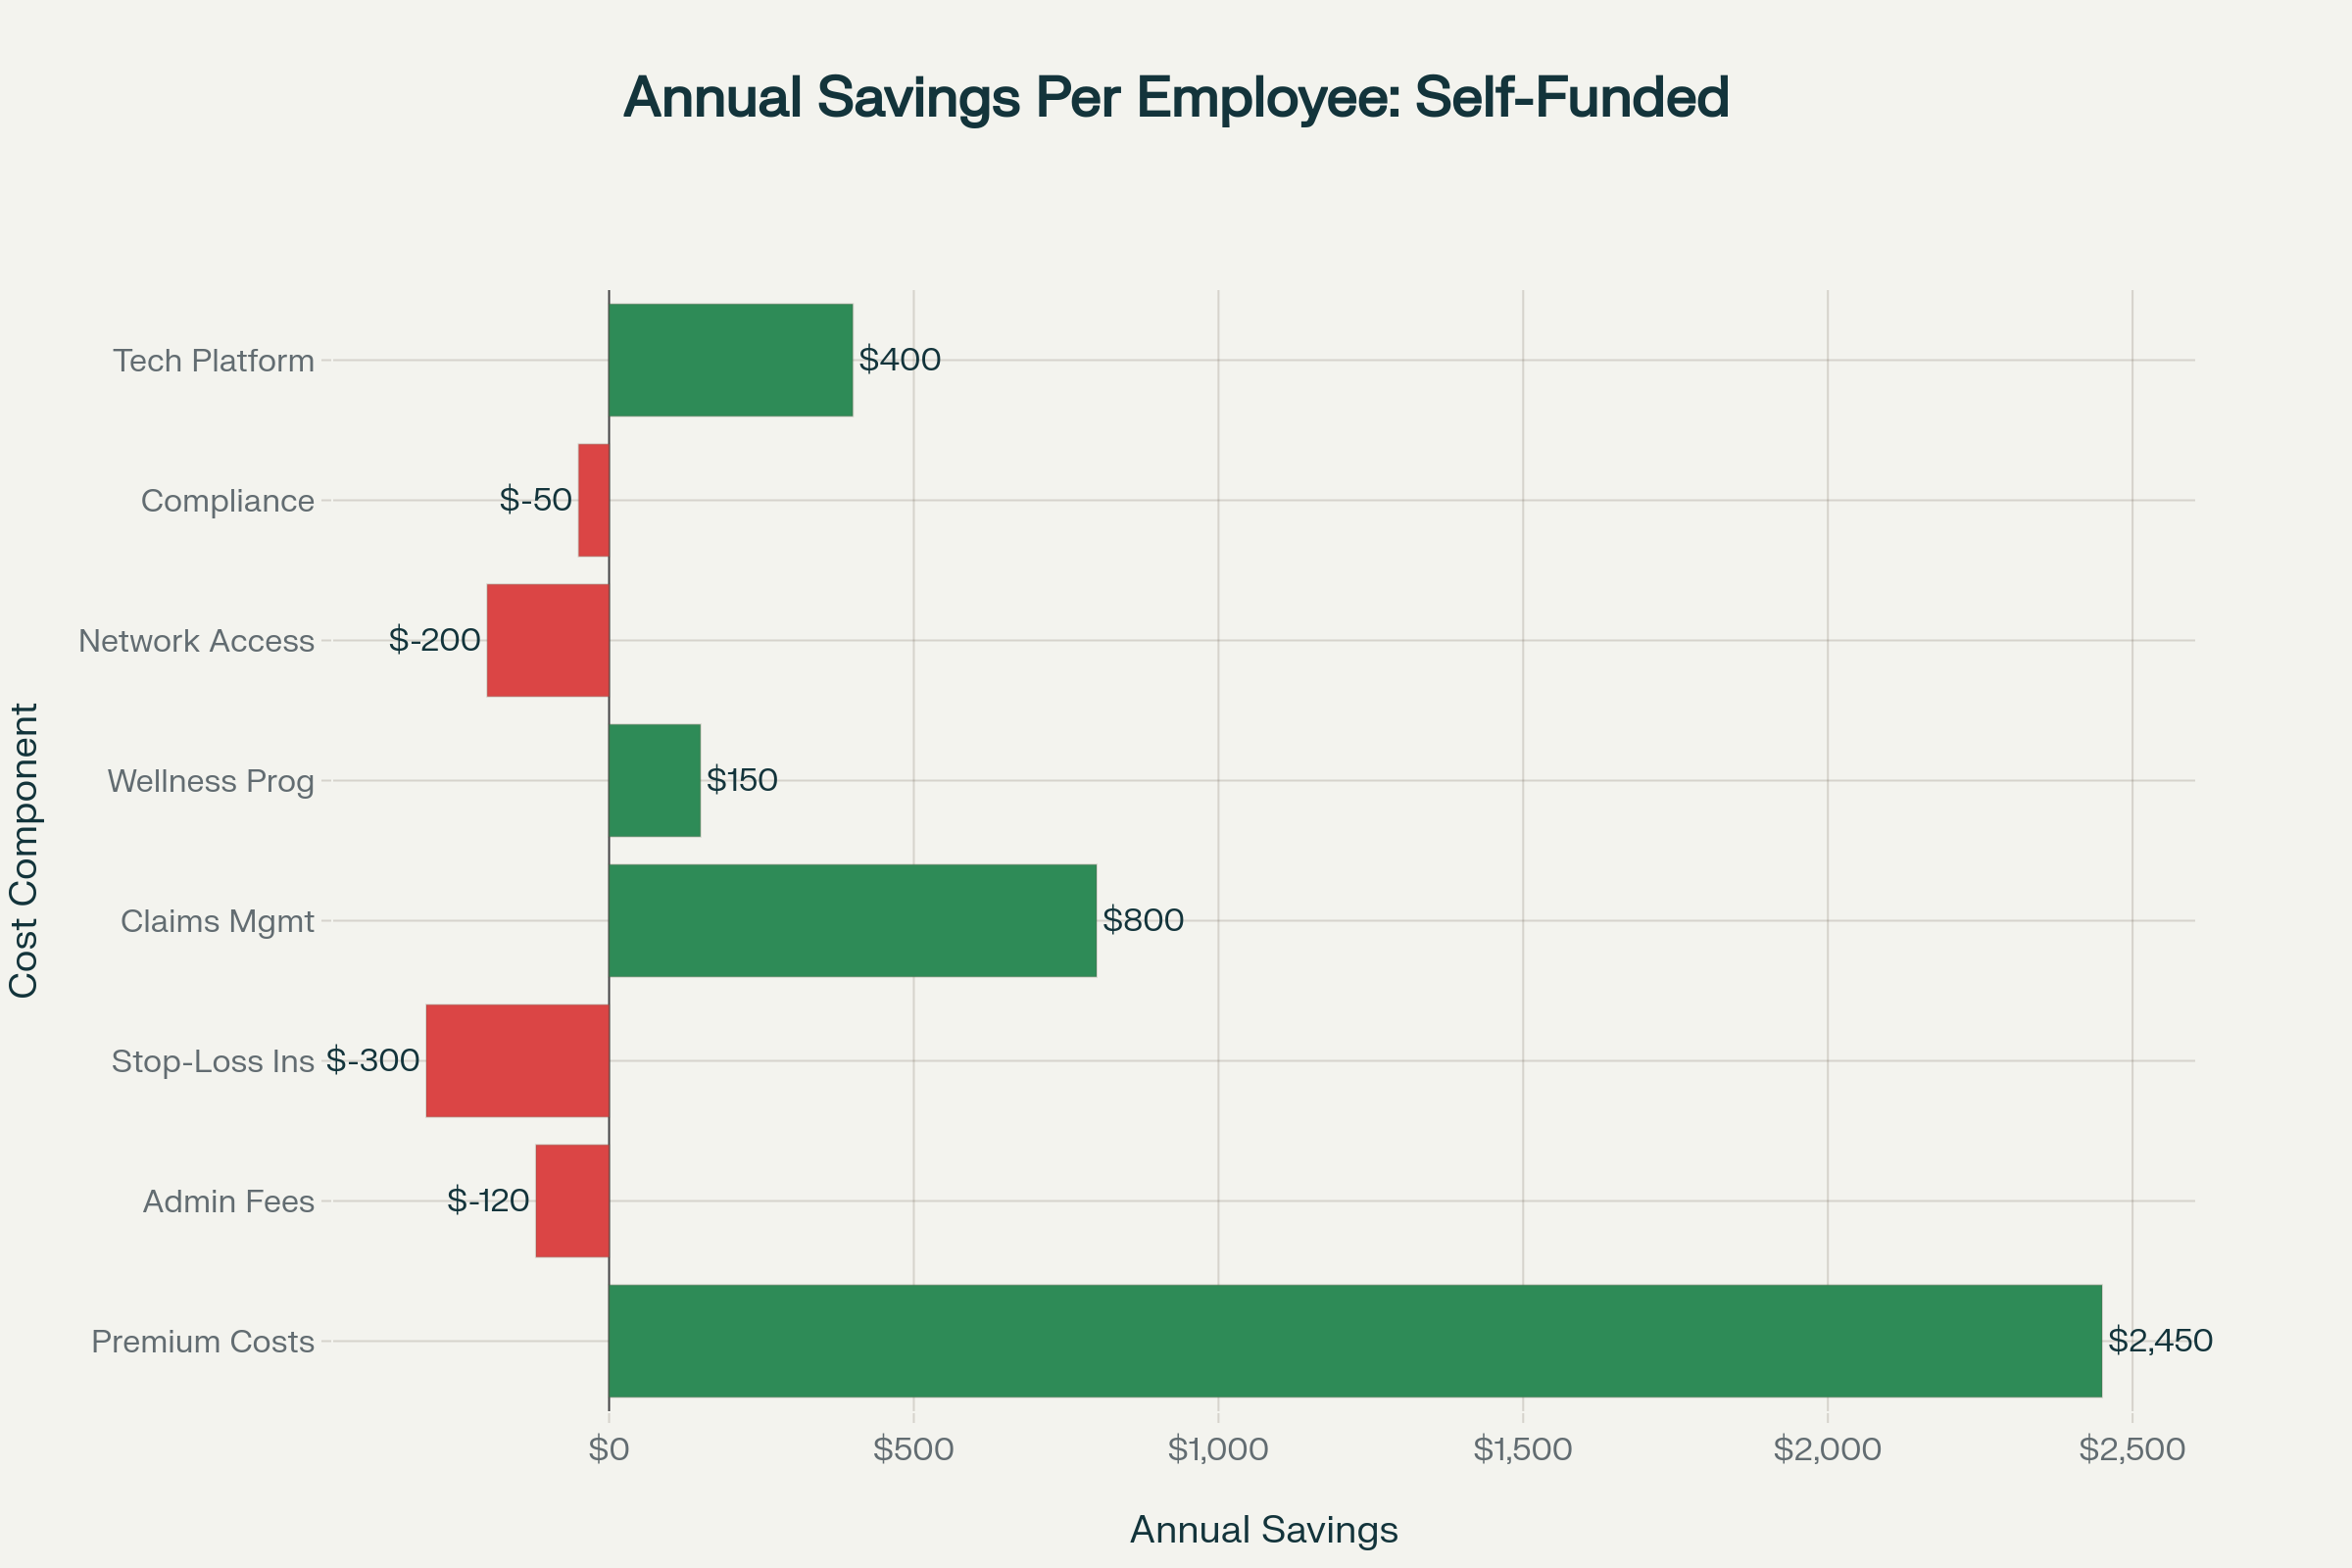
Self-Funded Savings Calculator
Estimate potential cost savings for your organization
Your Organization Details
Projected Savings
Enter your organization details to see potential savings
Implementation Guide
Step-by-step roadmap to self-funded health plan implementation
Compliance Requirements
ERISA/CAA Compliance
- Plan documents and SPD
- Fiduciary training
- Claims procedures
- Appeals process
HIPAA Requirements
- Privacy policies
- Security safeguards
- Business associate agreements
- Breach notification procedures
ACA Compliance
- Essential health benefits
- Preventive care coverage
- Mental health parity
- Reporting requirements
Utilization Patterns Analysis
Understanding healthcare utilization by demographics and risk factors
Healthcare Costs by Age Group
| Age Group | Avg Annual Claims | Chronic Conditions | Preventive Care Use | High-Cost Risk |
|---|
Key Insights
Age Distribution Impact
Organizations with older workforce (45+) see 2-3x higher claims costs but also higher preventive care utilization.
Chronic Disease Management
62% of employees aged 56-65 have chronic conditions, making population health management critical for cost control.
Preventive Care ROI
Higher preventive care utilization correlates with better long-term cost management and employee outcomes.